---blog Title---
Tracking Metrics in Adobe Analytics: A Strategic Guide
---desktop---
![]()
---mobile---

Tracking metrics in Adobe Analytics might seem straightforward—after all, it comes loaded with plenty of pre-defined options to get you started. But here's the reality: relying only on those standard metrics is like trying to see the full picture through a keyhole. They give you some insights, yes, but not nearly enough to make truly informed decisions. To truly harness the power of metrics analysis in Adobe Analytics, you need to go beyond the basics and leverage the full capabilities of the Adobe Analytics workspace.
To get a complete view of how your digital properties are performing, you need more than a basic checklist of numbers. You need the right numbers. As marketing expert Seth Godin points out, metrics like clicks and views are often prioritized simply because they're readily available, even though they rarely correlate with actual business success. That's why it's essential to go beyond standard metrics and incorporate custom and calculated metrics into your analytics strategy.
These metrics allow you to tailor your analysis to what matters most for your business, whether that's tracking conversions from a specific campaign, calculating engagement rates, or understanding how revenue is influenced by visitor behavior. By utilizing the full potential of Analysis Workspace, you can create a powerful tracking strategy that aligns with your specific business goals.
---outlined-cta--- Get your Free Adobe Analytics Audit Checklist – [ Download the Guide Now ]
In this guide, we'll show you how to combine the standard metrics Adobe Analytics provides with custom and calculated ones to create a robust metrics analysis framework. We'll also highlight why it's so critical to step beyond the defaults and ensure that your metrics align with your business goals. By the end, you'll be ready to take your analytics from ordinary to exceptional, making the most of Adobe Analytics' powerful features.
Let's start by understanding the building blocks: what metrics in Adobe Analytics actually mean and how they work.
Understanding Adobe Analytics Metrics
Adobe Analytics is all about turning data into actionable insights. At its core are metrics—the numbers that tell you how your website or app is performing. To maximize the value of your analytics, you need to explore advanced Adobe Analytics strategies and use metrics effectively to drive performance. This understanding forms the foundation of effective metrics analysis in Adobe Analytics.
What Are Metrics in Adobe Analytics?
Metrics represent the quantitative aspects of your digital properties. In the context of Adobe Analytics, they help you understand "how much" or "how many" for key interactions.
For example:
- How many people visited your site? (Visits)
- How many pages did they view? (Page Views)
- How long did they stay? (Time on Site)
These are standard Adobe Analytics metrics, and they form the backbone of most reporting dashboards. But to make sense of the data, you also need dimensions, which describe qualitative characteristics—like the type of device used or the traffic source.
Think of it this way: metrics give you the "score," while dimensions provide the "context" to understand that score. This distinction is crucial in Adobe Analytics, where understanding the relationship between metrics and dimensions is key to effective data analysis.
Metrics form the foundation of all reports in Adobe Analytics. But as we'll explore, not all metrics are equally useful. Knowing when to go beyond the basics is where the real value lies in metrics analysis.
Overview of Standard Metrics
Adobe Analytics comes with a host of pre-built metrics designed to cover common performance indicators. These are often referred to as "adobe analytics out of the box metrics". They include:
- Page Views: The number of pages a visitor loads.
- Visits: Each session where a user actively engages with your website or app.
- Bounce Rate: The percentage of single-page visits. In Adobe Analytics, bounce rate can signal ineffective landing pages but may also indicate that users quickly found what they needed.
- Exit Rate: In Adobe Analytics, exit rate measures the percentage of exits from a specific page compared to the number of page views for that page.
These metrics are a good starting point for your metrics analysis. They can tell you things like how many people came to your site, what they looked at, and whether they stuck around. But these metrics also have limitations. For example:
- Page Views: High numbers might look good, but they don't tell you if users found what they were looking for.
- Bounce Rate: A bounce isn't always bad—on some pages, like blogs, a quick visit may indicate users got what they needed.
Using standard metrics alone can lead to misleading conclusions. To truly understand performance, you need metrics that reflect your unique goals and challenges. This is where the power of Adobe Analytics' custom metrics and calculated metrics comes into play.
Key Performance Indicators in Adobe Analytics
Not all metrics deserve equal attention. The most important metrics—called Key Performance Indicators, or KPIs—are the ones directly tied to your business objectives. These are what you should track, analyze, and act on in your Adobe Analytics workspace.
For instance:
- If you're an e-commerce business, your KPIs might include conversion rates, average order value, or cart abandonment rates.
- For a media company, your focus might be on time spent per article, video completions, or ad impressions.
A good KPI isn't just a random number—it's a metric that directly shows whether you're meeting your goals. Selecting the right KPIs requires a clear understanding of your objectives and a willingness to customize your analytics setup to reflect them. This is where understanding Adobe Analytics terminology and metrics definitions becomes crucial.
Furthermore, armed with these metrics in Adobe Analytics, and using tools like calculated metrics Adobe Analytics or custom configurations, you can enhance user journeys and derive meaningful insights. With the right Adobe Analytics guide, you'll not only measure performance but also act on what truly matters.
Custom Metrics: Tailoring Analytics to Your Business
The beauty of Adobe Analytics lies in its flexibility. While standard metrics offer a good starting point, they're often too generic to address specific business needs. That's where custom metrics come in. They allow you to define measurements unique to your objectives, giving you deeper, more relevant insights into your audience and performance.
What Are Custom Metrics?
Custom metrics Adobe Analytics are user-defined measurements created to track what matters most to your business. Unlike pre-defined Adobe metrics, which focus on general web behaviors, custom metrics let you hone in on specific areas that align with your goals. These metrics are a key component of Adobe Analytics' core metrics analytics capabilities, offering greater flexibility and precision.
- Conversion Rate by Campaign: Instead of looking at overall conversion rates, you can track how each marketing campaign contributes to conversions.
- Engagement Scores: Combine multiple behaviors—like time spent, interactions, and repeat visits—into a single metric that reflects overall user engagement.
With custom metrics, you're not limited to what Adobe Analytics thinks is important. You set the rules based on what drives your success.
How to Create and Implement Custom Metrics
Building custom metrics in Adobe Analytics is straightforward, but it requires clarity on what you want to measure and why. Here's a step-by-step guide:
- Define Your Goal: Identify the specific question you're trying to answer. For instance, "How effective are my social media campaigns in driving purchases?" This step is key to aligning your Adobe Analytics KPIs with business objectives.
- Plan Your Metric: Determine what data points you'll need. For a social campaign conversion rate, this might include clicks from social media and completed purchases.
- Use Adobe Analytics' Metric Builder: Navigate to the custom metrics section in Analysis Workspace and combine the necessary data points into a new metric.
- Test Your Metric: Run initial reports to ensure the custom metric is calculating correctly. Look for any data anomalies or inconsistencies.
- Deploy and Monitor: Integrate your custom metric into dashboards and track it regularly.
---outlined-cta--- Access the Adobe Analytics Audit Checklist – Download Now
Common Pitfalls to Avoid:
- Overcomplicating Metrics: Simplicity is key. Avoid metrics that are overly complex or difficult for stakeholders to interpret.
- Neglecting Validation: Always test new metrics to ensure accuracy before making decisions based on them.
- Misaligned Goals: If your custom metric doesn't tie back to a clear business objective, it won't provide actionable insights.
Benefits of Custom Metrics for Strategic Decision-Making
Custom metrics unlock a level of specificity that standard metrics can't match. Combining these metrics with real-time CDP insights can provide a 360-degree view of the customer. Custom metrics allow you to:
- Get Targeted Insights: Focus on the metrics that directly impact your business goals.
- Drive Smarter Decisions: With more relevant data, you can make decisions based on what actually moves the needle for your business.
- Gain a Competitive Edge: Most businesses stick to standard metrics. By going custom, you get insights your competitors might miss.
For example, a retail brand wanted to measure the effectiveness of its "Buy Online, Pick Up In-Store" (BOPIS) strategy. Standard metrics like page views and visits didn't tell the full story. They created a custom metric to track the ratio of BOPIS orders to total online orders. The insights helped them identify underperforming regions and fine-tune their strategy, increasing BOPIS adoption by 27%.
---outlined-cta--- Implement Analytics Frameworks to Improve Application Usability - Get the Guide
Calculated Metrics: Unlocking Deeper Insights
Custom metrics let you tailor your analytics, but calculated metrics take it a step further by allowing you to create new metrics from existing data. These Adobe Analytics calculated metrics are built by applying mathematical operations to standard or custom metrics, giving you a way to derive deeper insights without additional data collection.
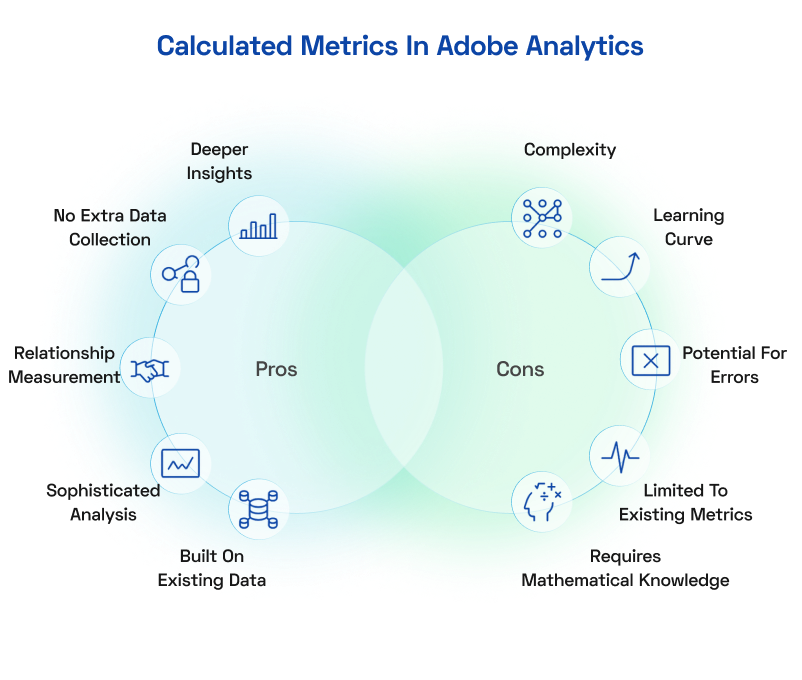
What Are Calculated Metrics in Adobe Analytics?
Calculated metrics are derived values that help you measure relationships between existing data points. Unlike custom metrics, which involve defining entirely new data measurements, calculated metrics take the data you already have and use formulas to create new insights. This is a powerful feature of the Adobe Analytics workspace that allows for sophisticated data analysis.
Examples of Effective Calculated Metrics
Here are a few calculated metrics that businesses commonly use to drive insights:
- Engagement Rate:Formula: (Engaged Visits ÷ Total Visits) × 100 This metric measures the percentage of visits where users performed meaningful actions, such as clicking a link, playing a video, or scrolling to a key section.
- Conversion Rate by Device Type:Formula: (Conversions from Device ÷ Visits from Device) × 100 This metric allows you to compare how well your site or app performs across desktops, mobile devices, and tablets.
- Revenue Per Visit:Formula: Total Revenue ÷ Total Visits A calculated metric dividing total revenue by the number of visits, offering a clear view of how much value each visitor contributes.
- Average Order Value (AOV):Formula: Total Revenue ÷ Number of Orders This metric measures how much, on average, customers spend per transaction.
---outlined-cta---
Step-by-Step: Creating Calculated Metrics
Building a calculated metric in Adobe Analytics is simple when you follow these steps:
- Define the Objective: Clearly state what you're trying to measure. For example, "How much revenue does each visitor generate?"
- Access the Calculated Metrics Builder: Open Adobe Analytics, and navigate to the calculated metrics section in Analysis Workspace.
- Create the Formula: Use the interface to select and combine existing metrics. For AOV, drag and drop "Revenue" and divide it by "Orders." For device-specific conversion rates, use "Device Visits" and "Device Conversions."
- Name the Metric Clearly: A name like "Mobile Conversion Rate" is more helpful than something generic like "Metric 1."
- Test Your Metric: Run sample reports to ensure the calculated metric is working as expected.
Pro Tips for Effective Calculated Metrics:
- Use Segments Wisely: Segments allow you to refine calculated metrics. For instance, calculate conversion rates for users from specific campaigns or regions.
- Keep Metrics Actionable: Make sure the insights derived from the metric can lead to measurable action, like changing ad spend or improving page load times.
---outlined-cta--- Analytics Techniques That Improve Application Performance - Download the Guide
Benefits of Calculated Metrics
- Precision Insights: Calculated metrics allow you to focus on the specific details that matter, such as differences in performance by device or channel.
- Improved Decision-Making: Metrics like AOV and conversion rates by device help you pinpoint opportunities and prioritize efforts where they will have the most impact.
- Strategic Reporting: Combining multiple data points into a single metric simplifies complex reporting and creates clarity for stakeholders.
A fashion retailer used calculated metrics to measure Conversion Rate by Device Type. Their analysis revealed mobile visitors converted at a rate of 1.8% compared to 4.5% on desktop. Further investigation showed that mobile checkout had unnecessary form fields that caused friction. By streamlining the mobile checkout process, they boosted mobile conversions by 14% within a quarter.
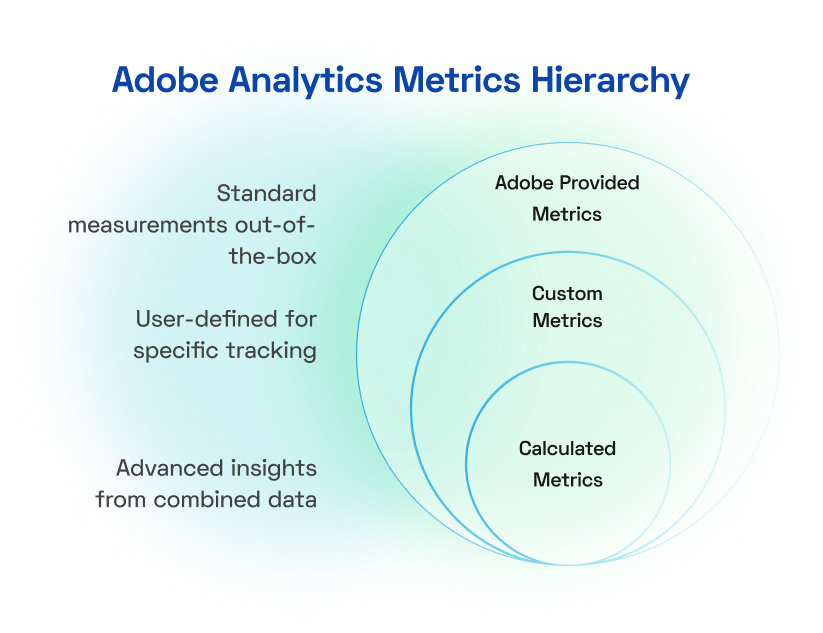
Combining Standard, Custom, and Calculated Metrics
Adobe Analytics offers an incredible range of metrics, but the real magic happens when you bring them together into a unified framework. By combining standard, custom, and calculated metrics, you can gain a 360-degree view of your digital performance, uncover hidden opportunities, and align data insights with your business objectives.
Example: E-commerce Dashboard
A unified dashboard for an e-commerce business might include:
- Standard Metrics: Total Visits, Page Views, and Bounce Rate.
- Custom Metrics: Cart Additions from Email Campaigns or Repeat Purchase Rate.
- Calculated Metrics: Average Order Value (AOV), Revenue Per Visit (RPV), and Conversion Rate by Device Type.
This combination provides a clear view of traffic patterns, campaign success, and how effectively visitors are converting into revenue.
Challenges in Combining Metrics
Integrating different types of metrics isn't always seamless. Data discrepancies and integration hurdles can be overcome by leveraging real-time insights with Adobe. Data accuracy is a frequent concern—discrepancies or incomplete data can skew results and lead to misguided decisions. For example, if one source tracks visits differently than another, your calculated metrics, like conversion rates, might be off. Integration issues arise when pulling data from various platforms, such as CRM systems or advertising tools, into Adobe Analytics. Misaligned definitions or data gaps can make it difficult to achieve a unified view. Additionally, resource allocation is a common obstacle, as creating, testing, and maintaining advanced metrics requires technical expertise and time.
Without proper prioritization, teams can get bogged down chasing metrics that don't deliver value. Addressing these challenges requires a mix of regular data audits, streamlined integrations, and clear collaboration across teams to ensure metrics are reliable and actionable.
Leveraging Combined Metrics for Advanced Reporting
Once standard, custom, and calculated metrics are integrated, the next step is to make them actionable. Advanced reporting turns raw numbers into meaningful insights by presenting them in ways that reveal trends, uncover anomalies, and highlight opportunities. By leveraging combined metrics in well-structured dashboards and automated reports, businesses can provide decision-makers with a clear, actionable view of performance.
Visualization Techniques
The way you present combined metrics can significantly impact their usefulness. Here are some effective visualization strategies:
-
Trend Analysis:
- Use line graphs to track metrics like Average Order Value or Revenue Per Visit over time. This helps identify patterns, such as seasonal spikes or performance dips, so you can act accordingly.
-
Segment Comparisons:
- Compare Conversion Rates by Device Type or Channel using bar or column charts. This makes it easy to spot performance disparities, such as a lower mobile conversion rate compared to desktop.
-
Goal Monitoring:
- Employ progress bars or KPI gauges to visualize how close you are to achieving targets, such as monthly revenue goals or campaign conversion benchmarks.
-
Automating Reports: Automation ensures stakeholders have consistent access to up-to-date insights without the burden of manual reporting.
---outlined-cta--- Drive Smarter Application Decisions Through Analytics - Download the Guide
Best Practices for Tracking Metrics in Adobe Analytics
Tracking metrics in Adobe Analytics is not a one-and-done process. It requires ongoing alignment with business goals, regular optimization audits, and staying ahead of emerging trends. By following best practices, you can ensure that your metrics remain accurate, relevant, and actionable.
Aligning Metrics with Business Objectives
The most effective strategies begin with clear goals. Your Adobe metrics should directly reflect your organization's key priorities—whether it's boosting revenue, improving retention, or increasing engagement rate in Adobe Analytics reports.
Tips for Aligning Metrics:
- Collaborate with Stakeholders: Include input from marketing, product, and leadership teams to define metrics that matter across departments.
- Keep Metrics Goal-Oriented: For instance, if the goal is to increase revenue, track metrics like Average Order Value (AOV), cart abandonment rates, and revenue per visit.
- Avoid Vanity Metrics: Metrics like total page views or downloads may look impressive but offer little insight if they aren't tied to meaningful outcomes.
Regular Auditing and Optimization of Metrics
Metrics can lose relevance or accuracy over time as business models evolve, tracking methods change, or new tools are implemented. Regular audits ensure your metrics stay aligned with goals and continue to provide reliable insights.
How to Audit Metrics Effectively:
- Review Performance Quarterly: Check if metrics are still tied to business objectives and whether any need adjustment.
- Check Data Accuracy: Use tools like Adobe Debugger to validate data collection processes and ensure metrics are calculated correctly.
- Eliminate Redundant Metrics: Streamline reporting by removing metrics that no longer add value or are duplicates of existing measurements.
Pro Tips:
- Utilize Adobe Analytics' Data Warehouse to dig into raw data for validation.
- Compare key metrics across reports to identify discrepancies or misaligned data sources.
---outlined-cta--- Access a Comprehensive Framework for Auditing Adobe Analytics Deployments - Download Now
Staying Current with Adobe Analytics Features
Adobe Analytics is constantly evolving, introducing new features and capabilities. Staying up-to-date with these changes can significantly enhance your metrics analysis:
- Explore New Metric Types: Adobe regularly introduces new metric types and functions. For example, the content velocity metric in Adobe Analytics measures how quickly users consume content on your site.
- Leverage Advanced Segmentation: Use segments to analyze metrics across different user groups, behaviors, or time periods.
- Utilize Attribution Models: Experiment with different attribution models to understand how various touchpoints contribute to conversions.
Enhancing Metric Performance
To get the most out of your metrics, consider these advanced techniques:
- Use Date Ranges Effectively: Compare metrics across different time periods to identify trends and seasonality.
- Apply Metric Calculations: Use Adobe's metric calculation features to create complex formulas that provide deeper insights.
- Implement Custom Events: Track specific user actions that are crucial to your business but not covered by standard metrics.
Leveraging Adobe Analytics Components
Make full use of Adobe Analytics' components to enhance your metrics analysis:
- Metric Manager: Use this tool to organize, tag, and approve metrics across your organization.
- Metric Compatibility: Ensure that your metrics are compatible with the dimensions and segments you're using for analysis.
- Metric Workflow: Establish a clear workflow for creating, testing, and implementing new metrics.
How to Choose the Right Adobe Analytics Metrics for Your Business?
Not every team needs the same insights from Adobe Analytics. Selecting the right metrics starts with knowing who's using them and what they aim to achieve. Here's a guide to help marketing, product, executive, and analyst teams pick metrics that drive strategic growth and deliver a unified customer view.
1. For Marketing Teams: Optimize Campaigns and Engagement
Focus on metrics that reveal campaign success and customer interaction:
- Engagement Rate: Track time on page and interactions to gauge content appeal.
- Calculated Metrics for Conversions: Measure campaign-driven actions like sign-ups or purchases.
- Bounce and Exit Rates by Source: Identify which channels keep users engaged or drive drop-offs.
Outcome: Refine campaigns in real time, boosting ROI and customer retention.
2. For Product Teams: Enhance User Experience
Choose metrics that uncover how users interact with your product:
- Time Spent per Feature: See which features hold attention to prioritize development.
- User Journey Tracking: Use flow reports to map navigation paths and pain points.
- Custom Events: Monitor specific actions (e.g., button clicks) to assess feature adoption.
Outcome: Build intuitive products that increase user satisfaction and loyalty.
3. For Executives: Drive Strategic Decisions
Focus on high-level metrics that tie to revenue and growth:
- Average Order Value (AOV) and Revenue Per Visit: Track financial performance per customer interaction.
- Attribution Models: Understand which touchpoints drive revenue across channels.
- Executive Dashboards: Use Metric Manager for clear, real-time KPI summaries.
Outcome: Align data with business goals, ensuring competitive advantage.
4. For Analysts: Uncover Deep Insights
Leverage granular metrics for segmentation and predictive insights:
- Advanced Metrics and Dimensions: Analyze detailed user behaviors (e.g., device type, location).
- Segmented Audiences: Create precise customer groups for targeted insights.
- Predictive Modeling: Use calculated scores to forecast trends like churn or engagement.
Outcome: Deliver actionable insights that shape cross-functional strategies.
The right metrics in Adobe Analytics depend on the decision-maker. Customizing dashboards and reports by role ensures better clarity, faster action, and more strategic alignment. When every team tracks what truly matters, your analytics become a catalyst for real business growth.
Conclusion
Tracking metrics in Adobe Analytics isn't just about collecting data—it's about collecting the right data. Relying solely on standard metrics may give you a baseline understanding, but it often leaves critical questions unanswered. To truly understand your digital properties and drive smarter business decisions, you need a combination of standard, custom, and calculated metrics.
Custom metrics allow you to align analytics with your unique business goals, while calculated metrics reveal deeper insights by exploring relationships and trends within your data. Together, these tools provide a holistic view of performance, helping you move beyond surface-level numbers and into actionable insights.
But implementing these metrics isn't just a technical exercise. It requires thoughtful alignment with business objectives, regular reviews to ensure data accuracy, and a willingness to adapt to new trends and technologies. This approach ensures your analytics framework remains relevant and continues to deliver value over time.
Now is the time to take your Adobe Analytics to the next level. Start experimenting with custom and calculated metrics today, and transform your data into a powerful decision-making engine. Optimize your analytics framework to be more than a reporting tool and driving measurable outcomes.
Frequently Asked Questions (FAQ)
1. What is the engagement rate in Adobe Analytics?
Engagement rate Adobe Analytics refers to how effectively users interact with your website or app. This metric can include actions like time on site, scroll depth, video plays, or multiple page views per visit. You can track it using calculated metrics in Adobe Analytics to reflect user behavior aligned with your business goals.
2. What are Adobe Analytics metrics and dimensions?
In Adobe Analytics, metrics are the numerical values (like page views or revenue), while dimensions categorize those metrics (like device type or traffic source). Understanding Adobe Analytics metrics and dimensions is key to building actionable reports and uncovering user trends across your digital properties.
3. Why are calculated metrics important in Adobe Analytics?
Calculated metrics Adobe Analytics enables you to create custom formulas by combining standard metrics. For example, you might calculate revenue per visit or engagement score. These help you go beyond basic data and create KPIs that are tailored to your unique business requirements.
4. How can I align metrics with business goals in Adobe Analytics?
The most impactful metrics in Adobe Analytics are those directly tied to your strategic objectives. For example, if your goal is to increase revenue, focus on Adobe metrics like Average Order Value, conversion rate, and cart abandonment. Avoid vanity metrics and prioritize those that deliver actionable insights.
5. Where can I find an Adobe Analytics guide for tracking metrics?
A reliable Adobe Analytics guide will help you understand how to use both standard and custom metrics effectively. Look for resources that explain Adobe Analytics metrics definitions, visualization best practices, and how to leverage features like segmentation and calculated metrics for better decision-making.
---Interests---
You may also be interested in

Are Predictive Models Still Relevant in the Age of Campaigns, Journeys, and Nudges?

A Step-by-Step Guide to Audit your Martech Stack

Digital Analytics Audit: Steps to Perform a Digital Analytics Audit for Business Growth