---blog Title---
How to Conduct Churn Analysis to Reduce Customer Churn: Methods & Examples
---desktop---

---mobile---

A loyal customer who has been with your brand for years suddenly stops engaging no more purchases, no logins, no interaction. What went wrong? Was it a better competitor offer, a poor experience, or something you didn’t even see coming?
This phenomenon, known as customer churn, can significantly impact a company’s revenue and long-term viability.
Churn is an inevitable challenge for businesses, but losing customers without understanding why can be costly. Churn analysis helps organizations identify patterns behind customer attrition and develop strategies to retain them.
So, what exactly is churn analysis, and why is it crucial for businesses? Let’s dive in.
What is customer churn analysis?
Churn analysis helps you connect the dots, understand why customers are disengaging, and take action before they leave for good. It enables you to spot early warning signals and uncover the reasons behind them—such as a drop in engagement, fewer logins, or shorter session times. Unfortunately, most businesses only notice churn when it’s too late. Every churn follows a pattern, and conducting churn analysis helps you identify these patterns and act proactively.
Simply put, churn analysis is the process of identifying, understanding, and predicting customer attrition (churn) in a business. It involves analyzing customer behavior, transaction history, engagement patterns, and other factors to determine why customers stop using a product or service. The goal is to uncover insights that help businesses reduce churn and improve customer retention.
Why Is Churn Analysis Important?
Losing customers directly impacts revenue, profitability, and long-term growth. Acquiring a new customer is often five times more expensive than retaining an existing one, yet many businesses focus more on acquisition while ignoring churn. The real problem isn’t just losing customers—it’s not knowing why they’re leaving.
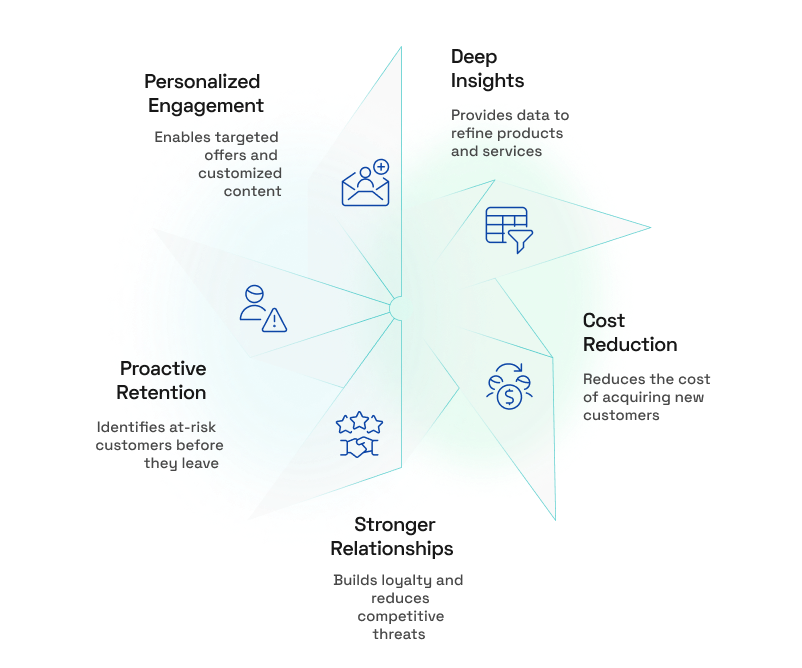
- Research shows that acquiring a new customer can cost five to seven times more than retaining an existing one. A high churn rate forces businesses to continuously spend on acquisition, which is far more expensive than keeping current customers. Churn analysis helps companies optimize retention strategies, reducing their reliance on aggressive acquisition efforts and deepening their understanding of retention meaning in banking and how to improve it sustainably.
- By leveraging churn analysis, businesses can segment customers based on behavior and preferences, enabling personalized engagement strategies such as targeted offers, customized content, and proactive support.
- Churn analysis helps businesses shift from a reactive to a proactive approach. Instead of waiting for customers to leave, companies can identify at-risk customers, understand their pain points, and take targeted actions to retain them.
- Companies that leverage churn analysis to proactively address customer concerns build stronger relationships, making it harder for competitors to lure customers away.
- Additionally, churn analysis provides deep customer insights—what’s working, what’s not, and where friction points exist. Businesses can use this data to refine products, enhance services, personalize customer interactions, and build long-term loyalty.
Types of customer churn
Not all churn is the same. Understanding the different types of churn helps businesses identify the root causes and implement effective retention strategies. Here are the key types of customer churn:
- Voluntary Churn: Customers actively choose to stop using a product or service. This could be due to dissatisfaction, better competitor offerings, pricing issues, or lack of perceived value.
- Involuntary Churn: Customers leave unintentionally due to reasons beyond their control, such as payment failures, expired credit cards, or technical issues.
- Revenue Churn: Occurs when customers don’t leave completely but reduce their spending—downgrading plans, purchasing less frequently, or switching to a cheaper alternative within the same company.
- Competitor-Driven Churn: Happens when customers switch to a competitor due to better pricing, features, or service.
- Engagement Churn: Customers remain subscribed but stop using the product or service, signaling a risk of future churn
Churn Analysis Methods to Predict Customer Attrition
Churn analysis is about understanding the "why" behind customer attrition and predicting "who’s next." The right methods help businesses shift from a reactive to a proactive approach, identifying early warning signs and taking action before customers slip away.
By understanding churn analysis methods like cohort analysis, machine learning models, and behavioral segmentation, businesses can move beyond surface-level data and uncover hidden patterns behind customer attrition.
Let's explore these methods and how they help in understanding the reasons behind churn.
1. Cohort Analysis: Spot Patterns in Customer Behavior
Cohort analysis groups customers based on shared characteristics (such as sign-up date, product usage, or demographics) to track their behavior over time. Instead of looking at customers as a whole, this method helps businesses analyze how different segments churn at different stages.
Common cohort types include:
- Time-based cohorts: Grouping users by sign-up date, purchase date, or first interaction.
- Behavior-based cohorts: Segmenting customers based on product usage, feature adoption, or engagement patterns.
- Demographic cohorts: Grouping customers by factors like location, age, or industry.
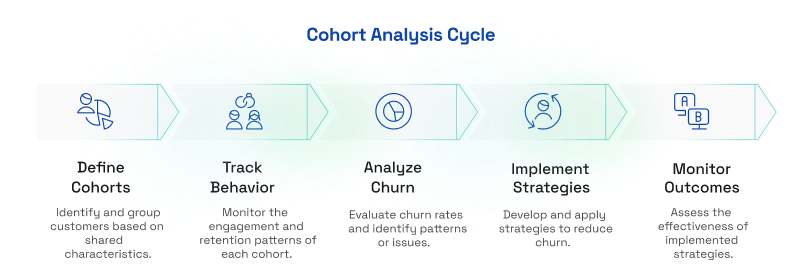
By breaking customers into cohorts and analyzing their retention trends, businesses can identify when churn occurs and which customer groups are most affected.
For Example:
- A sign-up month cohort may reveal that users who joined in January have a higher churn rate than those who joined in March.
- A feature usage cohort could show that customers who don’t use a key feature within the first month are more likely to leave
Once a cohort is defined, its retention and engagement patterns are tracked. A cohort retention table might look like this:
| Cohort (Signup Month) | Month 1 | Month 2 | Month 3 | Month 4 |
| January | 100% | 80% | 65% | 50% |
| February | 100% | 85% | 70% | 60% |
| March | 100% | 90% | 78% | 65% |
From this data, we can see that January's cohort churns the fastest, suggesting an issue with product experience or engagement.
This process helps answer critical questions such as which groups churn the most—for example, free trial users, mobile users, or customers from specific regions. It also reveals when churn typically occurs, such as after the onboarding phase, following a price increase, or during a product transition.
Additionally, you can determine what differentiates low-churn cohorts from high-churn ones—whether it's higher feature adoption, a smoother onboarding experience, or better customer engagement.
2. Predictive Analytics: Forecast Churn Before It Happens
Predictive analytics leverages machine learning and statistical models to analyze customer behavior and forecast which users are most likely to churn. Unlike traditional churn analysis, which examines past data to understand why customers left, predictive analytics enables you to anticipate churn before it happens and take proactive measures to retain at-risk customers.
The process typically involves the following steps:
- Data Collection: Gather customer interaction data, including product usage, transactions, support tickets, and engagement metrics.
- Feature Identification: Identify churn indicators such as reduced usage, slower responses, fewer logins, or increased complaints.
- Model Training: Use machine learning algorithms to analyze churn patterns and predict risks.
- Churn Risk Scoring: Assign probability scores to assess the likelihood of churn.
- Action & Automation: Use these scores to trigger retention strategies—such as offering discounts, providing personalized support, or granting exclusive benefits.
To effectively reduce churn using predictive analytics, businesses need a structured approach. The first step is ensuring clean and accurate data collection, as predictive models rely on high-quality customer information to generate reliable insights.
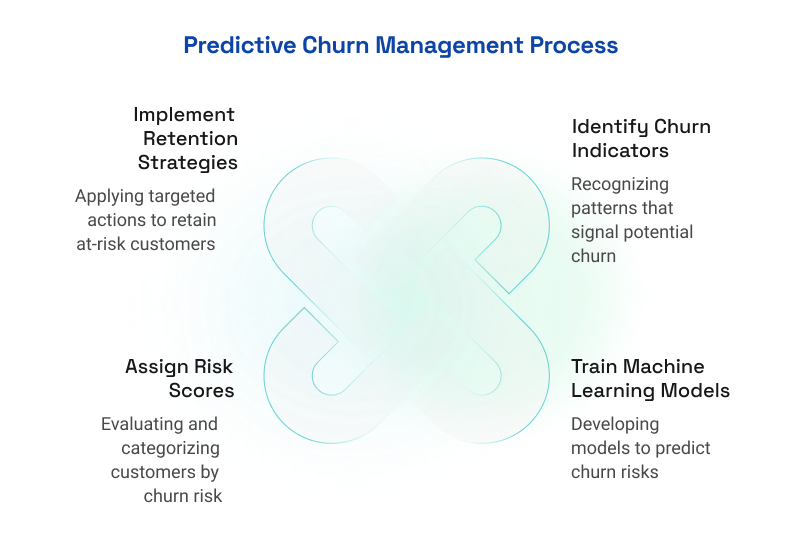
Training machine learning models to analyze past customer behavior allows businesses to assign churn risk scores to each user. These risk scores help segment customers into low, medium, and high-risk categories, allowing companies to prioritize retention efforts on the most vulnerable groups.
Predictive analytics requires ongoing refinement and retraining as new customer data becomes available. Businesses should regularly test the effectiveness of their churn prevention strategies and fine-tune their models to ensure they remain accurate and relevant.
3. Customer Segmentation: Personalize Retention Strategies
Customer segmentation is a powerful strategy that helps businesses understand their customers better and tailor retention efforts accordingly. Instead of treating all customers the same, segmentation allows businesses to classify users based on their behavior, engagement, and spending habits. This enables personalized interventions that improve customer experience, boost loyalty, and reduce churn.
The most common segmentation types include:
- Behavioral Segmentation – Groups customers based on their actions
- Risk-Based Segmentation – Identifies customer retention risks
- Value-Based Segmentation – Categorizes customers by their spending patterns
- Demographic & Psychographic Segmentation – Focuses on customer attributes
Once customers are segmented, businesses can analyze retention patterns within each group to uncover key trends. By studying which segments have the highest churn rates, when disengagement typically occurs, and which customers respond best to retention efforts, companies can craft targeted strategies.
For instance, high-value customers might churn due to a lack of premium support or exclusive benefits, while inactive users may have abandoned the product because of poor onboarding. Similarly, discount seekers might only engage during promotions. Understanding these patterns allows businesses to develop tailored retention strategies to keep each segment engaged.
Implementing segment-specific retention efforts not only reduces churn but also enhances the overall customer experience by making users feel valued and understood. It helps maximize Customer Lifetime Value (LTV) by keeping high-value customers engaged while optimizing retention budgets by focusing resources on the most critical segments.
4. Root Cause Analysis: Fix the Underlying Problems
Rather than just tracking churn rates, Root Cause Analysis (RCA) helps businesses uncover the real drivers behind customer attrition. Instead of addressing surface-level symptoms, RCA digs deeper to identify patterns, trends, and contributing factors that lead to customer dissatisfaction.
For example:
- A company sees a high churn rate and assumes competitors are to blame.
- RCA reveals that most customers actually leave due to a complex onboarding process.
- Instead of just offering discounts to retain customers, the company improves onboarding—leading to a long-term reduction in churn.
The process begins by gathering churn data from multiple sources, including exit surveys, customer feedback, support interactions, product usage analytics, competitor research, and insights from sales and retention teams.
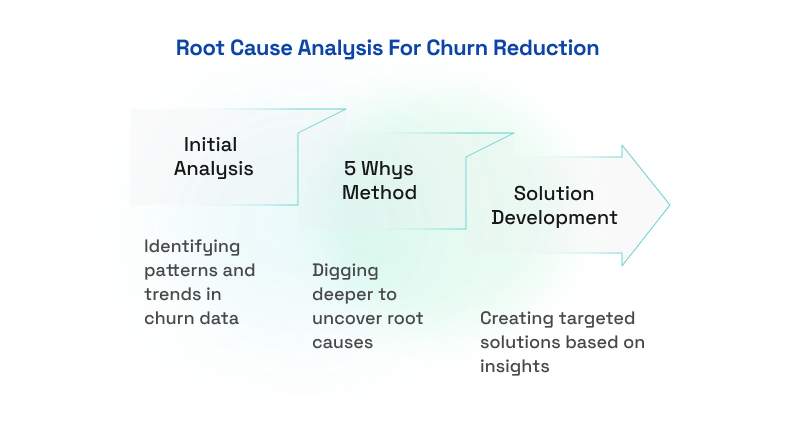
To develop meaningful solutions, businesses must go beyond surface-level reasons and dig deeper using the 5 Whys Method, a technique that involves repeatedly asking "why" to trace an issue back to its root cause.
Example: If pricing is cited as the reason for churn, businesses should ask:
- Why? Customers don’t see enough value in the product.
- Why? They aren’t using key features that differentiate the product.
- Why? They weren’t properly introduced to those features during onboarding.
- Why? The onboarding process is too generic and doesn’t highlight features relevant to different user needs.
- Why? The company hasn’t personalized onboarding based on user segments and behavior.
Without this deeper analysis, you might take the wrong approach such as offering discounts when the real solution is improving onboarding to showcase the product’s value.
A structured RCA approach helps businesses understand, categorize, and solve churn at its core, leading to higher customer retention, increased loyalty, and long-term business success.
5. Time-to-Churn Analysis: Pinpoint When Customers Are Likely to Leave
Time-to-Churn Analysis determines when a customer is most likely to stop using a product or service. Instead of just identifying who is at risk of churning, this approach focuses on when churn is most likely to happen within the customer lifecycle.
This process begins with a deep dive into customer lifecycle data, where businesses analyze historical churn trends to pinpoint the most critical timeframes for customer drop-offs.
---outlined-cta---
For example, a subscription-based app might find that 80% of churn occurs within the first 60 days, indicating an onboarding problem. Similarly, if trial users who don’t complete onboarding within a week churn at a 50% higher rate, it signals the need for a stronger engagement strategy.
The first step in time-to-churn analysis is to examine customer lifecycle data and pinpoint the moments when churn is most likely to occur. Businesses should answer key questions such as:
- When do most customers churn? (e.g., within the first 30 days, after 6 months, at renewal periods)
- What triggers churn? (e.g., lack of engagement, billing issues, unmet expectations)
- What actions reduce churn? (e.g., improved onboarding, proactive support, loyalty rewards)
Understand when churn happens and implement preemptive strategies to retain customers before they leave. For early-stage churn, customers might leave due to poor onboarding or a lack of immediate value. For mid-cycle churn, customers might disengage due to low feature adoption or declining interest.
Identifying the most common churn timeframes helps you take action before it’s too late.
6. Sentiment Analysis: Understanding Customer Emotions to Reduce Churn
Sentiment analysis evaluates customer emotions by analyzing textual data from reviews, emails, chat interactions, social media posts, and support tickets. Using Natural Language Processing (NLP) and machine learning, it determines whether sentiment is positive, neutral, or negative, helping you to understand customer perceptions.
To gain a comprehensive view, track sentiment across all touchpoints, including support tickets, chats, social media mentions, reviews, emails, surveys, and call scripts. AI-driven tools can then identify recurring themes in customer dissatisfaction.
For example, an AI model analyzing "Your service is too slow, and no one responded to my request" would detect negative sentiment and categorize it under customer service issues.
Once sentiment trends are identified, take proactive steps to reduce churn:
- Pricing concerns? Offer flexible plans or added value.
- Missing features? Gather feedback and update the roadmap.
- Slow support? Improve response times with chatbots or more agents.
- Service outages? Provide real-time updates and compensation.
By continuously monitoring customer sentiment, you can address issues before they escalate, reducing churn and enhancing customer satisfaction.
7. Survival Analysis: Predict Customer Lifespan
Survival analysis is a statistical technique used to estimate the time until an event occurs in this case, customer churn. Unlike traditional churn analysis, which examines who has already left, survival analysis predicts when a customer is likely to churn. It helps estimate the probability of a customer remaining active over time and identifies early signs of disengagement.
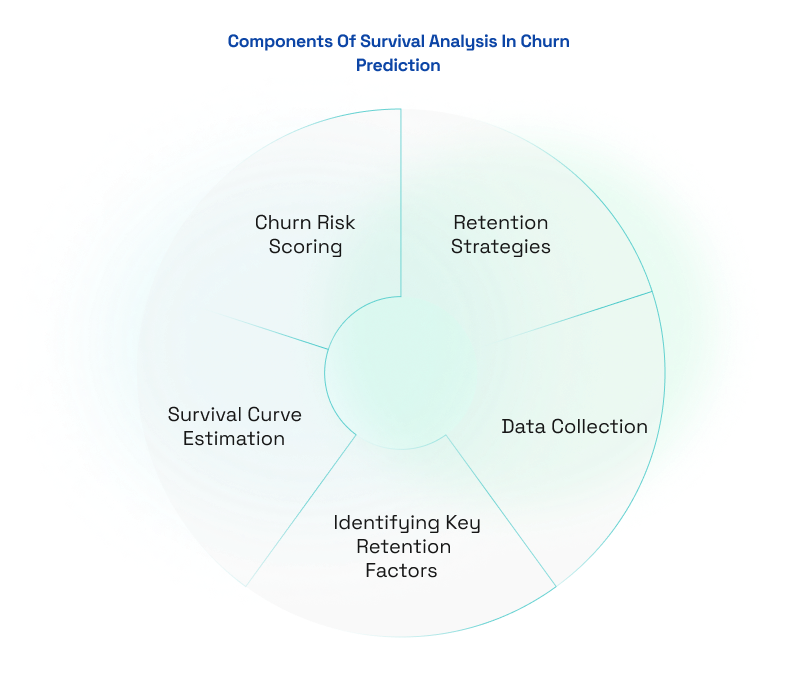
The core process includes:
- Data Collection: Gather customer data on tenure, engagement (logins, usage, purchases, support interactions), and churn events. Active customers are marked as censored data, meaning their lifecycle extends beyond the study period.
- Survival Curve Estimation: Visualize customer retention over time, identifying major drop-offs after trials, renewals, or product changes.
- Identifying Key Retention Factors: Use Cox Proportional Hazards Regression to determine factors affecting retention, such as frequent usage, onboarding success, and churn indicators like inactivity or negative sentiment.
- Churn Risk Scoring: Assign churn risk scores to predict a customer's likelihood of leaving based on historical patterns.
- Retention Strategies: Implement targeted engagement, proactive support, and loyalty incentives like personalized offers and rewards to reduce churn.
Survival analysis enables companies to predict and prevent churn by identifying high-risk periods and proactively intervening with personalized retention strategies.
How to Conduct Churn Analysis: A Step by Step Framework
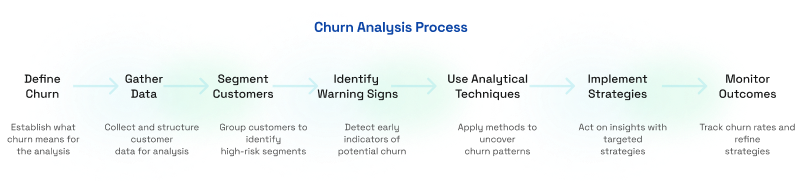
Step 1: Clearly define what churn means—whether it’s subscription cancellations, inactivity, or drop in purchases. This ensures you analyze the right customer behaviors.
Step 2: Gather customer interactions, engagement metrics, transaction history, and feedback. Clean and structure the data for meaningful analysis.
Step 3: Group customers based on tenure, behavior, and pricing tiers. This helps identify high-risk segments and tailor retention strategies.
Step 4: Spot warning signs like reduced engagement, complaints, or billing failures. Early detection enables proactive intervention.
Step 5: Use techniques like cohort analysis, predictive modeling, and journey mapping. These methods help uncover churn patterns and root causes.
Step 6: Act on insights with personalized outreach, product improvements, and loyalty programs. Proactive engagement reduces churn risk.
Step 7: Track churn rates, retention impact, and customer satisfaction. Continuously refine strategies to build long-term customer loyalty.
Key Challenges in Customer Churn Analysis
- Churn can vary by business model subscription cancellations, inactivity, or decreased purchases making it tricky to define and measure consistently.
- Incomplete, unstructured, or siloed data can lead to inaccurate churn predictions. Integrating data from multiple sources is essential but often complex.
- Churn signals aren’t always obvious. Subtle behavioral shifts, like reduced engagement, can go unnoticed without the right analytics in place.
- Customers leave for various reasons pricing, service issues, competition making it hard to pinpoint the exact cause of churn.
- Traditional models may not accurately forecast churn, requiring advanced AI/ML models that demand high-quality training data and expertise.
- Even with churn insights, businesses often struggle to implement effective, timely retention strategies due to operational bottlenecks.
- It’s challenging to track whether interventions like discounts, loyalty programs, or personalized messaging truly reduce churn without proper A/B testing.
Customer Churn Analysis Examples in Action
1. Identifying and Addressing Renewal Declines
If you're seeing a decline in customer renewals, conducting a churn analysis can help identify the root cause.
- Start by defining churn criteria, such as customers who haven’t logged in or renewed within 30 days. Next, collect relevant data, including login frequency, feature usage, and billing history.
- Use cohort analysis to compare churn rates across different signup months and identify trends.
- Look for churn signals, such as users who stop using key features, as they are at higher risk.
- Finally, implement an actionable strategy by setting up automated reminders and offering personalized discounts to re-engage users before their renewal date.
2. Identifying At-Risk Customers
If you're experiencing a drop in repeat purchases, a churn analysis can help identify at-risk customers and re-engagement strategies.
- Start by defining churn criteria, such as customers who haven’t made a purchase in the last 90 days.
- Collect relevant data, including browsing behavior, cart abandonment, and purchase history.
- Segment customers using RFM (Recency, Frequency, Monetary) analysis to identify high-risk groups.
- Look for churn patterns, such as repeated cart abandonment, which signals a higher likelihood of churn.
- Finally, implement an actionable strategy by sending personalized email offers or limited-time discounts to encourage customers to return.
Conclusion
By systematically identifying churn signals, analyzing trends, and implementing data-driven strategies, you can reduce customer attrition and enhance loyalty. The key is to act early, personalize engagement, and continuously refine retention strategies based on real insights.
---outlined-cta---
Looking for Churn Analysis Solutions? We Can Help You Understand Why Customers Leave and Take Action to Retain Them.
---Interests---
You may also be interested in

Thought Leadership
Are Predictive Models Still Relevant in the Age of Campaigns, Journeys, and Nudges?

POV
Tracking Metrics in Adobe Analytics: A Strategic Guide

Thought Leadership
A Step-by-Step Guide to Audit your Martech Stack