---blog Title---
Top 10 Data Analytics Tools & Platforms to Uncover Trends, Insights and Reporting
---desktop---

---mobile---
Every business today has access to massive amounts of data, but how can you turn that data into real, actionable insights? With the right data analytics tools, you can turn raw numbers into actionable insights that drive strategic decisions.
But which data analytics tools are worth your attention?
Whether you’re looking for visual dashboards or advanced machine learning capabilities, the perfect tool is out there for you.
Let’s explore the top 10 tools that will unlock the full potential of your data.
---cta---
Access Your Complete Data Preparation Guide
[ Free Analytics Checklist ]
Download Now
Top 10 best data analytics tools and platforms 2025
- SAS Business Intelligence
- Tableau
- Power BI
- QlikSense
- IBM Cognos
- Apache Spark
- KNIME
- Hadoop
- TensorFlow
- Google Data Studio
What Is Data Analytics?
Data analytics is the process of examining raw data to uncover trends, patterns, and actionable insights. It helps organizations make informed decisions, improve customer experiences, optimize operations, and drive revenue growth. Data analytics can be descriptive, diagnostic, predictive, or prescriptive, each serving unique business needs.
While data analysis focuses on analyzing historical data to predict trends, data analytics solutions are focused on processing raw data to extract actionable insights. Understanding these types of analytics is key to evaluating which tools will best meet your specific business requirements.
Let’s dive into the top data analytics tools that are transforming businesses worldwide.
Why Are Data Analytics Tools Important?
Data analytics tools are software applications or platforms designed to collect, organize, process, and analyze data. They help businesses and individuals uncover meaningful patterns, trends, and insights from raw data. Here’s why they’re important.
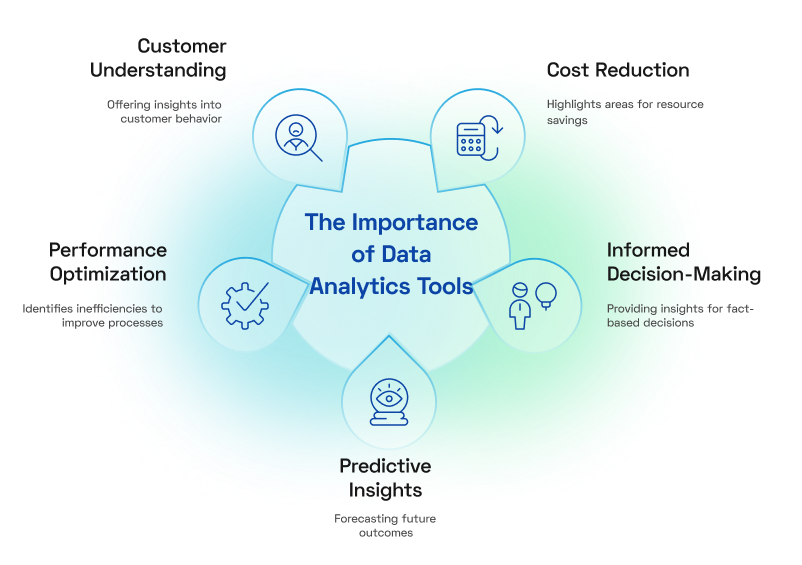
- Informed Decision-Making: They provide insights that help businesses make fact-based decisions.
- Performance Optimization: Identify inefficiencies and improve operational processes.
- Customer Understanding: Gain insights into customer behavior, preferences, and trends.
- Predictive Insights: Forecast future outcomes to stay ahead of trends.
- Cost Reduction: Highlight areas where resources can be saved or better utilized.
Top 10 Data Analytics Tools to Help You Make Better Decisions
From understanding customer journeys to identifying areas for improvement, each tool offers unique features tailored to different business needs. The following is a list of top data analytics tools, each with its distinct strengths and best use cases.
1. SAS Business Intelligence
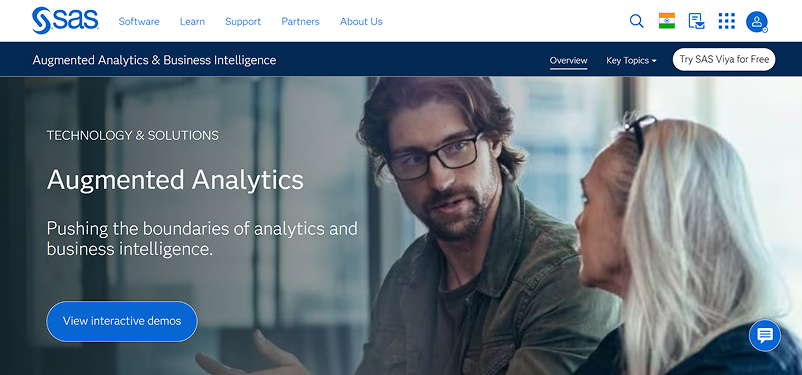
Best for Predictive Analytics and data integration
SAS Business Intelligence is a comprehensive platform that provides businesses with tools to collect, analyze, and visualize data. It focuses on turning raw data into actionable insights, helping organizations make informed decisions and achieve better outcomes. With its scalability, SAS BI caters to a wide range of users, from data analysts to business leaders.
Features of SAS Business Intelligence:
- Interactive Dashboards: Customizable dashboards allow users to monitor performance and uncover trends in real time.
- Predictive Analytics: Analyze historical data to anticipate future outcomes and plan strategies accordingly.
- Advanced Data Integration: Seamlessly combines data from multiple sources for unified analysis.
- Collaboration Tools: Enables teams to share insights and reports effortlessly, promoting data-driven decision-making.
---outlined-cta---
Best For: Enterprises managing large and complex datasets that require advanced analytics and forecasting capabilities.
2. Tableau
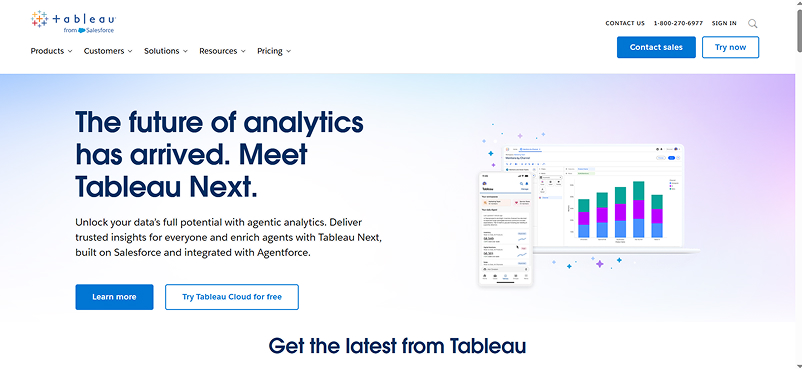
Tableau is a leading data visualization tool designed for ease of use and flexibility. Its drag-and-drop interface enables users to create visually appealing and interactive reports without requiring advanced technical skills. Tableau supports a wide range of data sources, making it a go-to choice for organizations looking to simplify data storytelling.
Features of Tableau:
- Data Visualization: Turns raw data into charts, maps, and dashboards that are easy to understand.
- Real-Time Analytics: Updates dashboards with live data to reflect the latest insights.
- Data Integration: Supports connections to multiple data sources, including cloud services and databases.
- Collaborative Sharing: Allows users to share dashboards and insights securely with stakeholders.
---outlined-cta---
Best For: Teams and organizations aiming to make data analysis accessible to all levels of expertise.
3. Power BI
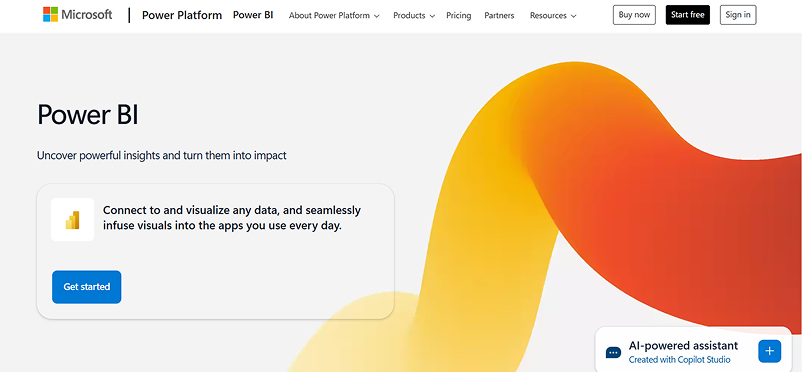
Power BI by Microsoft is a business analytics tool that transforms data into meaningful insights using interactive dashboards and reports. Its seamless integration with Microsoft Office products and Azure makes it a natural choice for businesses already in the Microsoft ecosystem.
Features of Power BI:
- Interactive Dashboards: Provides dynamic visualizations that are easy to customize.
- AI-Powered Insights: Offers machine learning-based recommendations to identify trends and outliers.
- Cloud Accessibility: Enables teams to access reports from anywhere via the cloud.
- Integration with Microsoft Tools: Works seamlessly with Excel, Teams, and other Microsoft applications.
---outlined-cta---
Best For: Businesses looking for a cost-effective, user-friendly analytics tool with strong Microsoft integration.
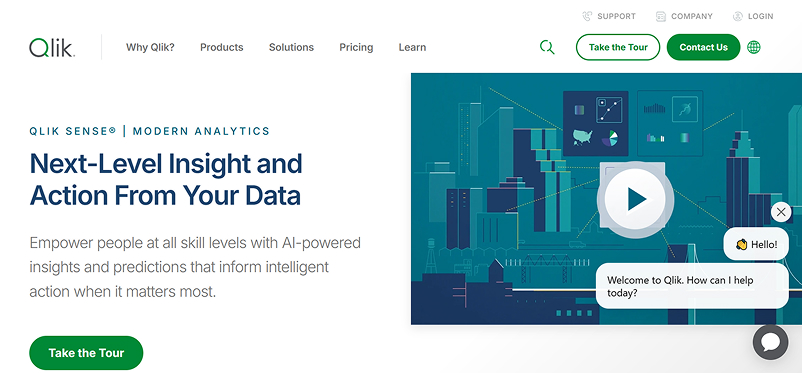
4. Qlik Sense
Qlik Sense is a self-service analytics platform that empowers users to explore and analyze data on their own terms. It uses an associative engine that allows users to investigate data relationships freely, uncovering insights that traditional tools might miss.
---outlined-cta---
Get the Checklist Used by Analysts to Prepare Data Effectively – Download Now
Features of Qlik Sense:
- Associative Data Model: Lets users explore data without being limited by predefined paths.
- Smart Visualizations: Automatically suggests the best ways to visualize data based on its structure.
- Data Integration: Merges data from multiple sources for a comprehensive view.
- AI-Assisted Analytics: Provides context-aware insights and recommendations.
---outlined-cta---
Best For: Organizations that value intuitive, exploratory analytics for uncovering deep insights.
5. IBM Cognos Analytics
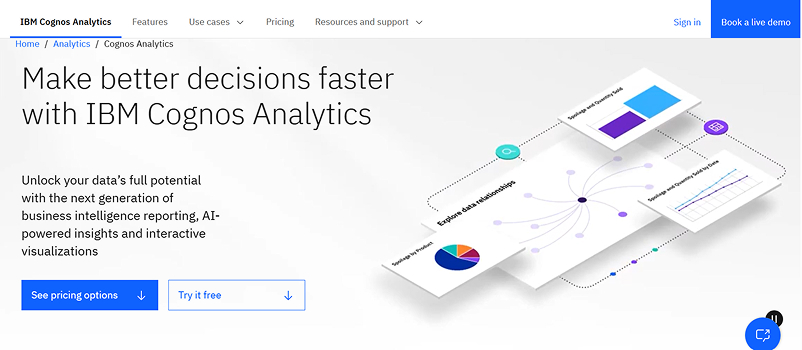
IBM Cognos is a robust business intelligence platform that combines AI with advanced reporting and data visualization tools. Its intuitive interface makes it easy for users to build and customize reports, while its AI-driven features enhance insights and decision-making.
Features of IBM Cognos Analytics:
- AI-Powered Recommendations: Offers insights and trend analysis with minimal manual input.
- Custom Dashboards: Allows users to create tailored views of key metrics.
- Data Governance: Ensures data security and compliance with industry regulations.
- Mobile Accessibility: Enables users to access dashboards and reports on the go.
---outlined-cta---
Best For: Large organizations looking for a secure, AI-powered analytics solution.
6. Apache Spark
Apache Spark is an open-source data processing framework designed for big data and machine learning applications. Known for its speed and scalability, Spark can handle large datasets and perform real-time data analysis.
Features of Apache Spark:
- High-Speed Processing: Processes data up to 100x faster than traditional systems.
- Real-Time Analytics: Allows businesses to act on insights as they happen.
- Machine Learning Libraries: Includes tools for predictive modeling and AI.
- Multi-Language Support: Works with popular programming languages like Python, Java, and R.
---outlined-cta---
Best For: Organizations working with large-scale data and requiring real-time analytics capabilities.
7. KNIME
KNIME is an open-source platform for data analytics, reporting, and integration. It offers a drag-and-drop interface for creating workflows, making it accessible to both technical and non-technical users. KNIME excels in helping businesses uncover actionable insights without requiring coding expertise.
Features of KNIME:
- Workflow Automation: Simplifies complex analytics tasks with an easy-to-use interface.
- Data Blending: Combines data from different sources for comprehensive analysis.
- Machine Learning: Supports predictive analytics with built-in machine learning tools.
- Custom Extensions: Offers a wide range of plugins to expand functionality.
---outlined-cta---
Best For: Businesses seeking a flexible, cost-effective analytics platform.
8. Hadoop
Hadoop is an open-source framework for distributed storage and processing of large datasets. It’s designed to handle vast amounts of data efficiently, making it a popular choice for big data projects.
Features of Hadoop:
- Scalable Storage: Spreads data across multiple servers to accommodate growth.
- Distributed Processing: Processes data across clusters for faster results.
- Cost-Effective: Uses commodity hardware to keep operational costs low.
- Fault Tolerance: Maintains performance even if hardware failures occur.
---outlined-cta---
Best For: Companies managing massive amounts of unstructured data.
9. TensorFlow
TensorFlow is an open-source framework for building machine learning and AI applications. Developed by Google, it’s widely used for creating models ranging from simple data predictions to advanced deep learning algorithms.
Features of TensorFlow:
- Scalable AI Models: Build and deploy machine learning models that adapt to your needs.
- Cross-Platform Support: Works on mobile, web, and server environments.
- Extensive Libraries: Offers pre-built components to simplify development.
- Community Support: Backed by a large community for resources and troubleshooting.
---outlined-cta---
Best For: Developers and businesses focusing on AI and machine learning solutions.
10. Google Data Studio
Google Data Studio excels in simplifying data visualization and reporting. It offers a user-friendly platform to turn raw data into actionable insights. Its seamless integration with various data sources and customization capabilities makes it a favorite for creating interactive dashboards.
Features of Google Data Studio:
- Interactive Dashboards: Create dynamic and visually appealing reports with customizable charts and graphs.
- Easy Data Integration: Connects effortlessly with Google services (e.g., Google Analytics, Google Ads) and other external data sources.
- Collaboration-Friendly: Share and collaborate on reports in real time, with options for editing and commenting.
- Customizable Templates: Provides pre-built templates to jumpstart your reporting.
- Real-Time Updates: Automatically refreshes data for up-to-date insights.
---outlined-cta---
Best For: Teams looking to simplify data reporting and visualization, especially when working with Google tools or presenting insights to stakeholders.
How Data Analytics Tools Are Applied Across Industries and Use Cases
Data analytics tools are only valuable when they solve real operational problems. From improving customer targeting to accelerating risk assessment, here’s how leading industries apply them effectively.
Retail
Retailers use tools like Tableau and Power BI to analyze inventory movement, in-store vs. online purchasing behavior, and customer segmentation. These insights help adjust merchandising strategies, localize promotions, and improve inventory accuracy across channels.
For example, retailers often use real-time dashboards to track product performance across regions and optimize restocking workflows without relying solely on end-of-quarter sales data.
Finance
Banks and insurance providers turn to platforms like SAS Business Intelligence and Apache Spark for real-time fraud detection, credit scoring, and risk modeling. These tools help handle high-velocity data from transactions and regulatory systems, enabling more accurate predictions and proactive compliance monitoring.
Use cases often include streamlining internal audit processes and enhancing decision support in loan processing through predictive scoring models.
Healthcare
Hospitals and providers use platforms such as KNIME and IBM Cognos to aggregate patient data, analyze diagnostic trends, and support clinical decision-making. Data integration across departments enables better resource allocation, improved appointment scheduling, and outcomes tracking.
Many healthcare institutions rely on analytics platforms to monitor treatment efficacy and optimize bed management during peak demand.
E-commerce
E-commerce businesses use Mixpanel and Google Data Studio to track key actions like product views, cart activity, and conversion paths. These insights feed into optimizing product recommendations, refining user experience, and improving re-engagement strategies such as cart recovery workflows.
Businesses also use these tools to segment users by lifetime value or purchasing frequency, supporting more focused retention efforts.
Marketing & Advertising Agencies
Agencies use tools like Kissmetrics and Google Analytics 4 to evaluate the effectiveness of marketing funnels across channels. By tracking user journeys from first interaction to conversion, they can fine-tune messaging, allocate ad spend better, and A/B test creative strategies based on reliable behavioral data.
Cross-channel attribution and campaign cohort analysis are key use cases that drive improved reporting and higher client retention.
---outlined-cta---
Download the Free Checklist for Structuring Data for Analytics – Get Started
How to Choose the Right Data Analytics Tools
Selecting the right data analytics tool is critical to leveraging data effectively for your business. With so many options available, making the best choice requires evaluating your specific needs, goals, and technical capabilities. Here’s a step-by-step guide to help you choose the right tool:
- Define Your Goals: Identify what you aim to achieve, such as tracking website performance, improving customer retention, or optimizing marketing campaigns.
- Assess Business Needs: Choose tools suited to your business size, whether you're a small business needing simplicity or a large enterprise requiring advanced analytics.
- Check Data Integration: Ensure the tool integrates with your platforms (e.g., CRM, marketing tools) and supports all data sources like websites or apps.
- Evaluate Features: Match the tool’s features with your goals—e.g., Mixpanel for customer journeys, Matomo for privacy, or Adobe Analytics for advanced customization.
- Ease of Use: Select a tool with an interface that fits your team’s skill level—HubSpot for simplicity or Adobe for advanced users.
- Scalability: Opt for scalable tools if your business is growing.
- Consider Cost: Compare pricing and ensure the tool offers value for money.
- Privacy Compliance: Choose privacy-focused tools like Matomo or Open Web Analytics if your business requires GDPR or CCPA compliance.
- Trial and Testing: Use free trials or demos to test features, integration, and ease of use before committing.
- Read Reviews: Check reviews and case studies to learn how the tool performs for businesses similar to yours.
- Support and Community: Ensure the tool provides reliable customer support, training, or a strong user community, especially for platforms offering advanced business intelligence features.
Conclusion
Whether you’re drawn to the advanced capabilities of Tableau, the accessibility of Qlik Sense, or the privacy-focused features of Matomo, there’s a tool tailored to meet your unique needs. As you evaluate your options, remember that the best tool is the one that aligns with your business goals, integrates seamlessly with your systems, and empowers your team to uncover insights with ease.
By choosing the right data analytics tool, you’re not just investing in technology—you’re investing in the future success of your business. The question is, are you ready to turn data into your most valuable asset?